| |
||||||||||||||||||||||||||||||||||||||||||||||||
|
||||||||||||||||||||||||||||||||||||||||||||||||

|
||||||||||||||||||||||||||||||||||||||||||||||||
Overview
In this experiment, you prepared nine different mixtures of solutions of iron(III) and 5-sulfosalicylic acid (SSA), and measured the % Transmittance of these mixtures with the Spectronic 20 spectrophotometer (the product of the reaction is colored purple). The mixtures were prepared systematically, from the first mixture (in which there was a small amount of iron and a large amount of SSA present) to the last mixture (in which there was a large amount of iron but only a small amount of SSA present). You calculated the absorbance of each solution (from its % Transmittance) and then made a graph in which you plotted these absorbances versus the mole fraction SSA for each solution. The graph should show a maximum, which represents the molar ratio in which iron(III) and SSA react.
When two chemical substances react with each other, they react in a certain fixed, definite mole ratio (the stoichiometry of the reaction. When you prepare the set of systematically-varied mixtures of SSA and iron(III), only one of the mixtures reflects the correct mole ratio for the substances to react to the maximum extent possible. The mixture in which the substances have reacted to the maximum extent possible has the deepest purple color (largest amount of product formed).
Calculations
Suppose the following data had been recorded for the experiment
% Transmittance of Solutions
Page 47, Part IIA. Calculation of Absobance of Solution in Test tube #3It is the absorbance of a colored solution which is directly related to the concentration of the colored species in the solution. The absorbance is calculated from the measured % Transmittance (a derivation follows):
Be very careful how you use your calculator for this calculation. Some calculators require different keystrokes for using the logarithm of a number in a calculation. Absorbance values should come out to be between 0 and 2: if you get any other sort of number, you are using your calculator incorrectly!!
For solution #3, the % Transmittance was 27.7%. The absorbance corresponding to this is
B. Calculation of the moles of Fe+3 is Test Tube #3To calculate the number of moles of iron(III) present in Test tube #3, you need two bits of information. You need to know the volume of the stock Fe(III) taken as well as the concentration of the Fe(III) stock solution.
On Page 43 at the bottom is the volume of iron(III) that was to be placed into each of the test tubes. For Test Tube #3, you should have used 3.00 mL of the iron(III) stock solution.
You should have recorded the exact concentration of the iron(III) solution from the bottle label on the data page (Page 47, top). For my data above, the concentration of iron(III) is 1.65 × 10⁻³ M (M means moles of Fe3+ per liter).
Given this, calculate the number of moles of Fe(III) in Test Tube #3, then click here to check your answer. C. Calculation of the moles of SSA in Test Tube #3This calculation is similar to that in Part B, only for SSA in Test Tube #3 (rather than Fe3+). On Page 44 is a table which indicates the amount of SSA solution you were supposed to have used for each mixture: for Test Tube #3, you should have used 7.00 mL.
You should have recorded the concentration of the stock SSA solution in your data: for my table of data above, the concentration of SSA is 1.71 × 10⁻³ M Given this, calculate the number of moles of SSA in Test Tube #3, then click here to check your answer. D. Calculation of mole fraction of SSA in Test Tube #3The mole fraction of a given component in a mixture represents the number of moles present of the component of interest, divided by the total number of moles of all components present. We have a mixture containing 4.95 × 10⁻⁶ moles of Fe3+ and 1.20 × 10⁻⁵ moles of SSA.
Using this data. Calculate the mole fraction of SSA in Test Tube #3, then click here to check your answer. E. Calculation of mole fraction Fe(III) in Test Tube #3This calculation is based on the same data as in Part D above, only in terms of Fe(III) rather than SSA:
Alternatively, since there are only two components in the mixture, and since the sum of all the mole fractions of the components in a mixture must equal 1,
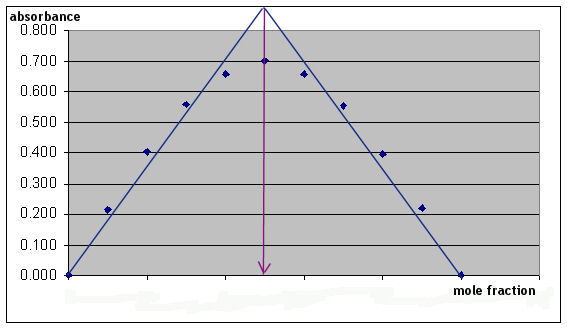
Page 48, Part IIIA. Summary of ResultsThis table just summarizes all your results for Absorbance and Mole Fraction for each of your solutions. The calculations are done exactly as illustrated above, only substituting the correct volumes of Fe and SSA for the individual solutions. B. Results from GraphWhen plotting your graph, be sure to follow the instructions for graphing in the Appendix to the lab manual. When you plot your nine data points, you should notice that there is a group of ascending data points and a group of descending data points. In addition to drawing a smooth curve through the data points, you should plot two lines on your graph: one which encompasses the ascending data points and one which encompasses the descending data points. The intersection of these two lines more easily shows the location of the maximum point on your graph (relative to the mole fraction, horizontal scale).
Here is a crude example of the general shape of the graph (your own graph should reflect your own data and should be drawn more carefully).
1. This point is read off the graph. 2. This can be read off the graph, or you can realize that XFe = (1 - XSSA) 3. This represents the answer to 1 divided by the answer to 2 4. This represents the ratio determined in 3 rounded to the nearest whole numbers.
|
||||||||||||||||||||||||||||||||||||||||||||||||