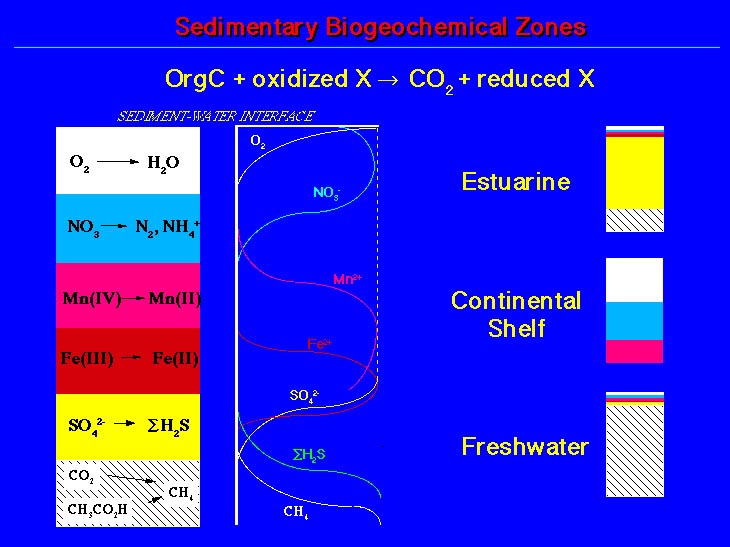
Left: Vertical order of zones indicating the electron acceptors
used and the typical end products.
Middle: Depth profile of compounds normally used to delineate
which zone occurs at which depth. Note that in some cases it is the electron
acceptor concentration that is used, whereas in other cases it is the end product.
The difference depends mostly on which compound is most easily measured.
Right: Relative thickness (vertical extent) of each zone in
different sediment types. Marine sites (top two) have much more sulfate than
freshwater so sulfate reduction dominates anaerobic activity in the sea while
methanogenesis dominates anaerobic activityin freshwater sediments.
Note: Turning the diagram left by 90° shows the order of electron acceptor use over time in a sealed bottle (x axis as time).