|
|
Energy States of Multi-Electron Atoms
Although it is relatively
easy to predict the ground state electron configuration of an element,
examining other possible configurations and how they might interact further
complicates the picture. Using a p2 configuration (as
in carbon) as an example, there are three major energy levels possible
for the two electrons. In addition, the lowest major level is further
split into three slightly different energies due to spin-orbit coupling.
Spin-orbit coupling is a magnetic interaction which results when the spin
and angular orbital momenta of individual electrons are strongly coupled
together.
The different energy
levels of the electrons are designated using term symbols (or term
states). A term symbol consists of an upper case letter (S,P,D,F,G,H,
etc.) which corresponds to the total orbital angular momentum quantum number,
L, for the energy state. The term symbol is preceded by a superscript
which is the spin multiplicity of the configuration, and relates
directly to the number of unpaired electrons in the energy state.
If spin-orbit coupling occurs, than a subscript follows the upper case
letter. The subscript is the value of J, the total angular momentum
quantum number. The process for determining term states and their
relative energies will be illustrated with a p2 configuration.
Making a Microstate Table
The most systematic
way to determine all the energy states for a particular electron configuration
is to create a microstate table. The microstate table lists all
of the possible arrangements of electrons for a specified configuration.
The table will show all the possible arrangements of electrons. Once
the table is completed, quantum numbers can be determined for the atom,
rather than the individual electrons. These atomic quantum numbers
(L, S and J) are used to determine the term symbols for the atom.
The quantum numbers
that describe states of multi-electron atoms are:
L = total orbital angular momentum quantum numberThe values of L and S are obtained using the microstate table, and relate directly to the quantum numbers of individual electrons. These quantum numbers describe collections of microstates.
S = total spin angular momentum quantum number
J = total angular momentum quantum number.
the possible values of L = l1+l2, l1+l2-1, l1+l2-2, .../l1-l2/ (L must be positive or 0))The values of L and S can be related to atomic quantum numbers ML and MS. Note the upper case subscripts are used for multi-electron atoms, whereas lower case designations are used for individual electrons. Just as the quantum number ml describes the component of the quantum number l in the direction of a magnetic field for an electron, the quantum number ML describes the component of L in the direction of a magnetic field for an atomic state. Likewise, ms describes the component of an electron's spin in a reference direction, and MS describes the component S in a reference direction for an atomic state. L and S are the largest possible values of ML and MS. The relationship between atomic quantum numbers and electron quantum numbers is summarized below.
the values of S = s1+ s2, s1+ s2-1, s1+ s2-2, ..../s1- s2/ (S must be positive or 0)
|
|
|
|
|
|
|
|
|
For a p2 configuration, the values of ml for each electron can be 1, 0 and -1. The value of L (the total orbital angular momentum quantum number) used to obtain the letter of the term symbol, can therefore range from a value of 2 (obtained from l1+l2) down to a minimum of 0 (obtained from /l1-l2/). The The easiest way to determine all of the term symbols for the configuration is to use a microstate table. The table will contain all the possible electron configurations of two electrons in a p subshell. Note that configurations which violate the Pauli exclusion principle are not included in the table. The table will include all possible electron configurations (called microstates) for all values of ML (which range from 2 to -2 for a p2 configurations) and all values of MS (which range from 1 to -1 for two electrons). Each microstate is represented by a number which is the l value of the orbital and a superscript + or - which indicates the value of ms for the electron. Thus, 1+1- represents a pair of electrons in the p orbital which has a value of l equal to +1. The electrons have opposite spins (indicated by the + and -), so they are paired.
MS
|
|
|
|
|
|
|
|
||
|
|
|
1-0+ |
|
|
|
|
0+0- -1-1+ |
|
|
|
|
-1-0+ |
|
|
|
|
The microstate table
can be used to determine the possible values of L and S, and the term states
for a p2 configuration. For ML =2, there
is only one microstate in the MS = 0 column. This is the
maximum value of ML in a series that ranges from
+2 down to -2. All microstates associated with this series are indicated
in red in the above table. The microstates indicated in
red
give rise to a term symbol or term state in which L=2, and S=0. The
term symbols which are generated by various values of L and S are summarized
below:
|
|
|
|
|
|
|
| Term Symbol |
|
|
|
|
|
The term symbol for the
red microstates in the table above will have a D designation, since L=2.
The spin multiplicity designation is equal to 2S+1, where S is the total
of the spins for the electrons in an energy state. For the red microstates
in the table, S = 0, and the spin multiplicity is equal to 1. The
term symbol used to designate all of the red microstates in the table is
1D.
This term is referred to as singlet D.
Term symbols for
the remaining microstates must also be assigned. The microstates
with the same term symbol will be grouped in a rectangular array, just
as the 1D microstates were. There is a set of 9 microstates
which are related to the same energy state and term symbol. These
are in a 3X3 rectangle which has ML = 1, 0 and
-1, and the value of MS = 1, 0 and -1. These microstates
are indicated in blue. The term symbol
for these microstates will be 3P, because the maximum value
of L=1, and the maximum value of S=1. This term is referred to as
triplet P.
There is one microstate
that does not yet have a designation. It is the one in the center
of the table, O+O-. This microstate has an
L=0, and S=0, so its term symbol is 1S, or singlet S.
To summarize, the electron configuration p2 has three major
energy levels, designated as 3P, 1D, and 1S.
Hund's rules can be used to determine which term state has the lowest energy.
Term States for Many Electron Atoms
The more electrons in an atom or ion, the greater the number of microstates, energy states and term symbols generated. For example, a d2 electron configuration generates 45 microstates and term states of 1S, 3P, 1D, 3F and 1G. In general, you can look up the term states for a given configuration, rather than having to derive them. However, it is quite simple to determine the ground term. The ground term will have the highest spin multiplicity (maximum number of unpaired electrons) and the highest value of L (maximum values of ML. So, for a d2 configuration, there will be two unpaired electrons, for a multiplicity of 3. You can write out the orbitals and their values of ml to obtain the ground term value of L. For d2, the five orbitals have ml values of 2,1,0,-1 and -2. Since the multiplicity rule requires that the electrons be unpaired in the ground term, the two electrons will have parallel spins in the orbitals with the two highest values of ml. The value of L will be 2 + 1, or 3, and the letter designation is F. Thus, the ground state term for a d2 configuration is 3F.
The simplest configuration for a transition metal is d1. The ground level term state for the free ion will be 2D, because the multiplicity is 2(1/2) +1=2, for a single electron, and the maximum value of L=2, corresponding to a term symbol of D. Because there can be no electron-electron repulsions or interactions, the level will split in an octahedral field, just like d orbitals split, into a T2g (lower) level and an Eg (upper) level. The term symbols for these new levels will still be doublets, because they could only contain a single unpaired electron. As the strength of the ligand field increases, the magnitude of the splitting, Do, increases. This information can be summarized in a Correlation diagram, in which the free ion is shown on the left side, and the levels which result from the splitting in an octahedral field appear on the right side.
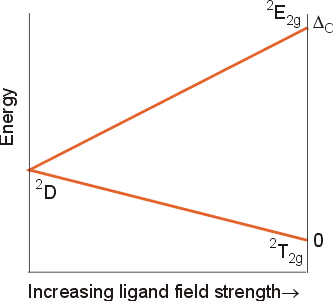
Other energy states of the free ion will also split in an octahedral field. In addition, the designations for the new energy states must have labels consistent with the symmetry of the point group (Oh). The designations of the new energy states and their "parent" energy states are shown below.
|
|
|
|
|
|
|
|
|
|
|
|
|
|
|
|
|
|
|
|
|
|
|
|
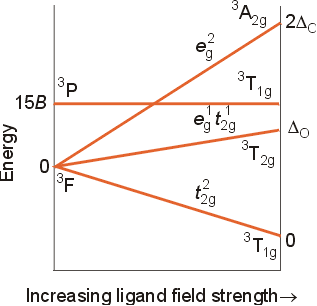
The correlation diagrams for multi-electron configurations can be quite complicated, but are extremely useful in explaining the spectra of transition metal complexes. For a d2 configuration, the free ion has the following ground level energy state: Maximum L= 2+1=3, so the letter designation is F, and the multiplicity will be 2(2/2) +1=3, for a term state of 3F. The other term states arising from a d2 configuration can be found in the text on table 11-5 (page 361). The other terms are 3P, 1S, 1D, and 1G. A correlation diagram for this configuration is shown below. Note that the free ion terms will split slightly in a weak field, and resolve into term states which correspond to recognizable electron configuration in an infinitely strong octahedral field. The relative energies of the levels has been obtained using calculations and experimental data. A few key features of the diagram should be pointed out.

The notes at the far
right side of the diagram show the electron configuration of the metal
ion in an infinitely strong octahedral field. The ground energy state
of the ion in an infinitely strong octahedral field will be t2g2,
because this would have two electrons in the lowest set of orbitals with
parallel spins. The next highest energy state would have the configuration
t2geg, representing one electron promoted to the
higher, eg set of orbitals. the highest energy state would
correspond to a configuration of eg2, with two electrons
in the upper set of orbitals.
In actual coordination
complexes, the environment of the metal is intermediate between the free
ion case and the infinitely strong ligand field. As can be seen from
the correlation diagram, each free-ion irreducible representation is matched
with (correlates with) a strong-field irreducible representation having
the same symmetry. The different energies on the correlation diagrams
relate to the absorption spectra of transition metal complexes. Certain
electronic transitions are favored over others, and the rules governing
these transitions are called selection rules.
Selection Rules
The relative intensities of absorption bands are governed by a series of selection rules. On the basis of symmetry and spin multiplicity of ground and excited electronic states, two of these rules are:
Tanabe-Sugano Diagrams
Tanabe-Sugano diagrams
are special correlation diagrams that are especially useful in the interpretation
of the electronic spectra of coordination compounds. In these diagrams,
the lowest (ground state) energy state is plotted along the horizontal
axis. As a result, vertical distance above this axis is a measure
of the energy above the ground state. For the d2 configuration,
the 3T1g energy state is the baseline of the horizontal
axis. The excited states are shown as well. The quantities
plotted in the Tanabe-Sugano diagrams are as follows:
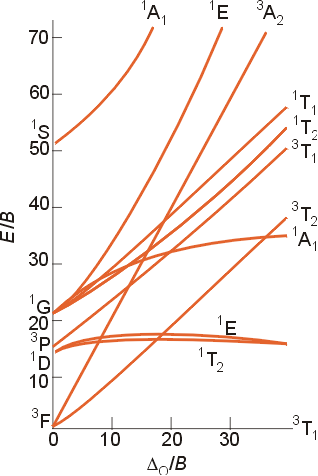
Note that in the above diagram (as in many such diagrams) the subscripts (all g in this case) have been omitted for clarity.
Relationship to Spectra of Complex Ions
Below is the spectrum of the d3 complex [Cr(NH3)6]3+. The two broad absorptions around 25,000 cm-1 correspond to transitions involving electrons in the d orbitals.
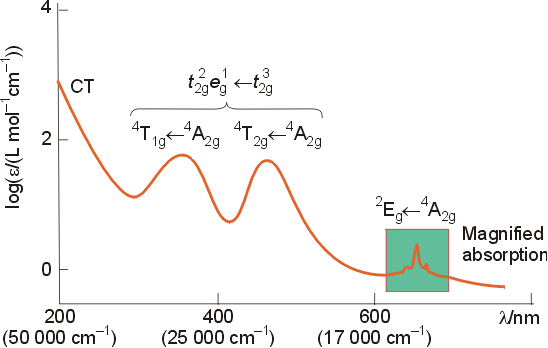
The bands in the spectrum have been labeled, both with symmetry labels, and with electron configurations. The two absorptions involving d to d transitions will be explained qualitatively, and then related to the Tanabe-Sugano diagram for a d3 configuration. On a qualitative basis, it might seem like only one energy should be seen for a t2g3 to t2g2eg1 transition. The splitting pattern for this complex is:
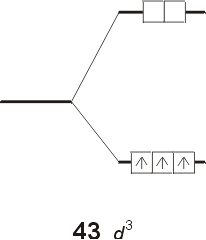
Upon closer examination, it can be seen that transitions from the lower t2g level to the higher eg level are not all the same. In the ground state, electrons occupy the dxy, dxz, and dyz orbitals, and they will absorb energy and get promoted to either the dz2 or dx2-y2 orbitals. If promotion takes place from the dxy to the dz2 orbital, the transition shifts electron density from the xy plane to the high electron density z axis. The z axis is rich in electron density because both the dxz and dyz orbitals, which contain an electron each, have electron density along the z direction. This transition will result in an increase in electron repulsion. An alternative transition could promote an electron from the dxz to the dz2 orbital. This transition involves a small relocation of electron density, as the electron is already in an electron rich environment. As a result, the two transitions discussed will have distinctly different energies. In examining all the other combinations of transitions, there is either a large shift in electron density, or a small shift. That is all transitions will fall into one of these categories, with three involving a large shift (from the dxz and dyz to the dx2-y2 ) and three involving a smaller shift ( the dxy to the dx2-y2 , and the dyz to the dz2 ) in electron density. The two types of transitions are illustrated below. The type of transition shown in illustration (a) is from a low density area to a high density area. The illustration (b) transition is between areas of more comparable electron densities.
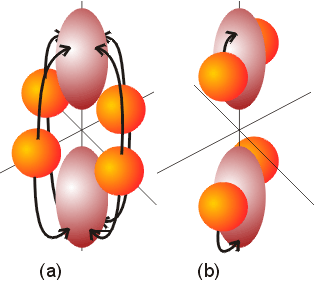
Examination of the
spectrum of the complex is consistent with this analysis, with two peaks
of equal size in the region associated with d to d
transitions.
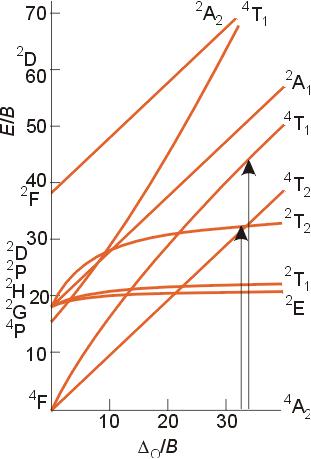
The Tanabe-Sugano
diagram for a d3 configuration is shown below. The two
arrows indicate the spin-allowed transitions which correspond to the analysis
above and the two peaks shown in the region of the spectrum near 25,000
cm-1. The third spin-allowed transition from the ground
state to the upper level 4T1 is obscured by the strong
charge transfer band in the spectum above. Note that the subscript
g
for gerade is left off for clarity.
Using Tanabe-Sugano
Diagrams - Determining Dofrom
Spectra
The ease with which Do can be obtained from spectra depends upon the electron configuration of the metal and the clarity of the spectra. Often bands are overlapping, and it is difficult to determine the true absorption peaks. Assuming the spectra are resolved and absorptions are clearly defined, the configuration of the d electrons in the metal will dictate the ease with which the spectra can be interpreted.
d1, d4 (high spin), d6 (high spin), d9
In each of these cases, the absorption spectra will result from the excitation of an electron from a t2g orbital to an eg orbital, with the excited electron configuration having the same spin multiplicity as the initial configuration. In each case, there is a single excited state of the same spin multiplicity as the ground state. As a result, there is a single spin-allowed absorption, with the energy of absorbed light equal to Do . Examples of these complexes include [Ti(H2O)6]3+, [Cr(H2O)6]3+, [Fe(H2O)6]2+, and [Cr(H2O)6]2+. The spectra of these complexes show a single absorption band, with occasional splitting due to a Jahn-Teller distortion.
d3 and d8
These configurations have a ground state F term. This term splits in an octahedral field into an A2g, a T2g and a T1g term as illustrated in the Tanabe -Sugano diagram above to help explain the spectrum of [Cr(NH3)6]3+, a d3 complex. For a d3 or d8 configuration, the term of lowest energy is the A2g. The difference in energy between this term and the T2g term (the next lowest energy state) is equal to Do . To obtain the value of Do , you just need to determine the energy of the lowest energy transition in the absorption spectrum of the complex. Additional examples of these types of complexes are [Cr(H2O)6]3+ and [Ni(H2O)6]2+. For the complex [Cr(NH3)6]3+, the value of the lowest energy absorption is 21,550 cm-1. The hexaaqua complex has its lowest energy band at 17,500 cm-1, indicating that ammonia produces a stronger ligand field than water for a given metal ion.
d2 and d7 (high spin)
The term for the free ion ground state is 3F, but the determination of the value of Do is a bit more complicated than the previous cases. The best way to interpret the spectra is to consult the appropriate Tanabe-Sugano diagram.

The ground state for a d2 configuration is 3T1g, and there are three excited states with the same multiplicity ( 3T2g and 3A2g terms both arising for the free ion ground state F term and a 3T1g term arising from the free ion P term). Please note that the labels in your text and on the Tanabe - Sugano diagram above contain an error. The triply degenerate state which arises from the P term is 3T1g, and not 3T2g. The two terms of like symmetry, 3T1g, may mix, and the result of mixing is that as the field strength increases, the states appear to repel each other, and the lines in the Tanabe-Sugano diagram curve away from each other. As a result of the mixing of these states, and the subsequent curving of the ground energy state, the determination of the value of Do is made more difficult. The value of Do is calculated using the ratios of the absorption frequencies in the visible spectrum of the complex. This method will be illustrated in class.
d5 (high spin) Complexes
All d-d transitions are spin forbidden, and hence very weak. Complexes of Mn2+ are colorless or faint pink (due to a spin-forbidden transition).
d4-d7 (low spin)
The spectra of these complexes require a complicated analysis which will not be covered in this course.
Tetrahedral Complexes
Transitions between the e and t2 orbitals are no longer Laporte forbidden, as the molecule doesn't have a center of symmetry. As a result, absorptions may be more intense. The electron configurations of tetrahedral complexes can be compared to those of octahedral complexes, and Tanabe-Sugano diagrams for octahedral complexes may be used to interpret the spectra of tetrahedral complexes. For example, the arrangement of a single electron in an octahedral complex is the same as the arrangement of a missing electron (hole) in a d9 tetrahedral complex.
Charge Transfer Spectra
Charge transfer spectra
usually contain a very intense absorption in the ultraviolet or visible
spectrum. These transitions are both Laporte and spin allowed, and
hence have extremely high intensity. The transition can involve the
transfer of an electron from molecular orbitals which are primarily on
the ligands to a molecular orbital which is primarily on the metal.
This is known as a ligand to metal transfer (LMCT). These occur
when the ligand has lone pairs of relatively high energy and/or the metal
has low lying empty orbitals. Typical examples include metal ions
which cannot have d to d transitions, such as Cd2+, Hg2+,
Fe3+, or Mn7+ and Cr6+.
Electron transfer
from the metal to the ligands is also possible. In these cases (CTTL),
the ligands typically have empty antibonding orbitals, such as CO, cyanide,
SCN1-and bipyridine.
Copyright ©1998 Beverly J. Volicer and Steven F. Tello, UMass Lowell. You may freely edit these pages for use in a non-profit, educational setting. Please include this copyright notice on all pages.