 Atlantic Hurricane
Principles of
Earth & Environmental Systems II
ENVI.2020
|
|
Principles of
Earth & Environmental Systems II |
| Course Home | Syllabus | Schedule | Supplemental Materials | Links |
| PDFs of Lecture PowerPoints | |||
| Supplemental Graphics | |||
| Atmospheric processes | |||
 |
 |
 |
|
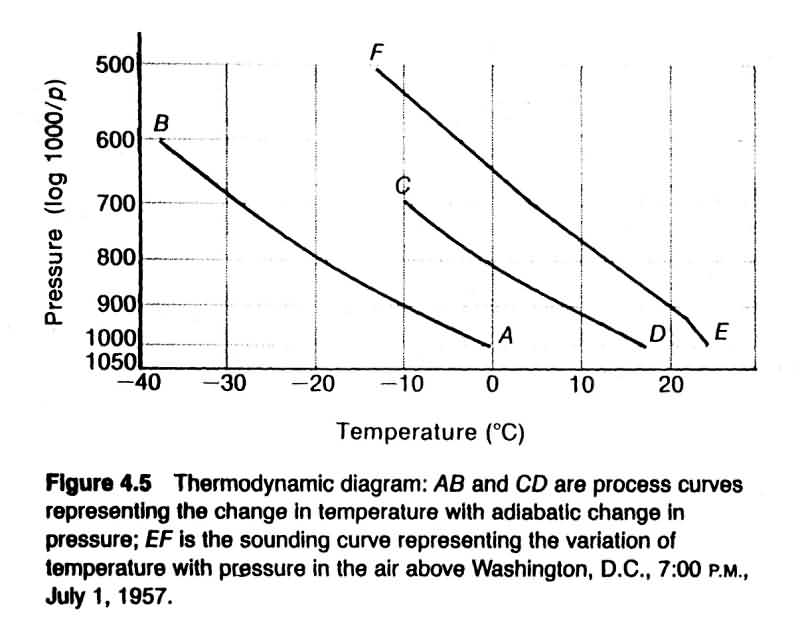
| Thermodynamic diagram showing process and sounding curves. |
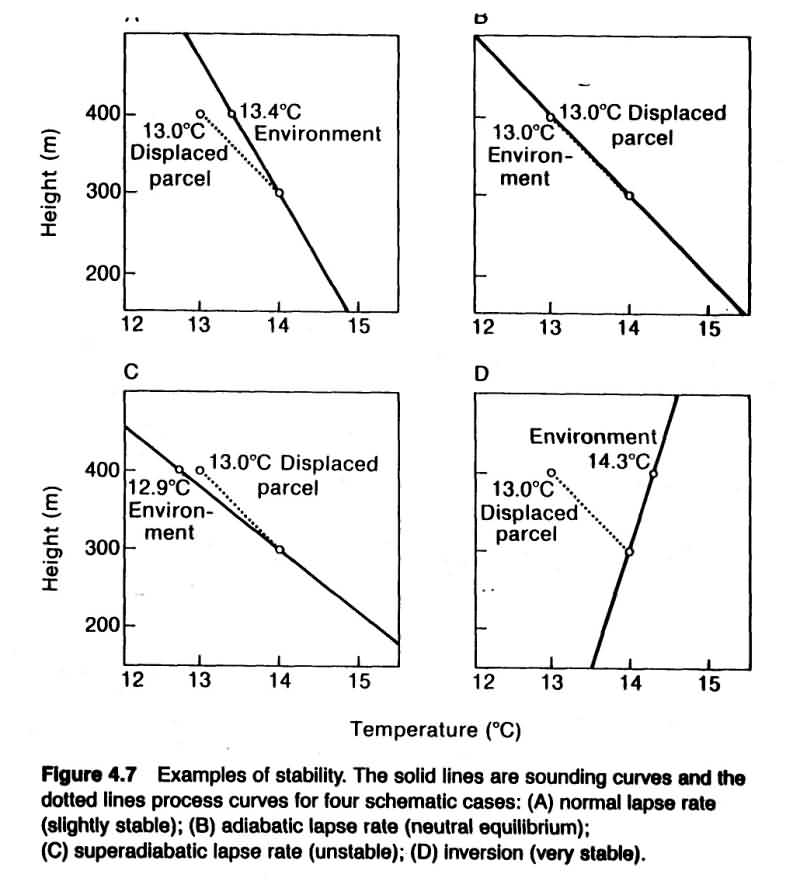
Examples of atmospheric stability. |
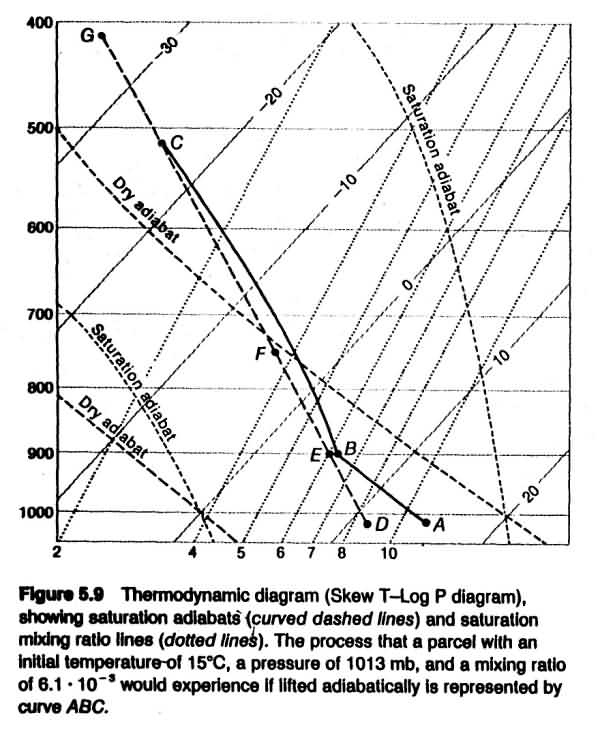
Skew T - Log P diagram. |
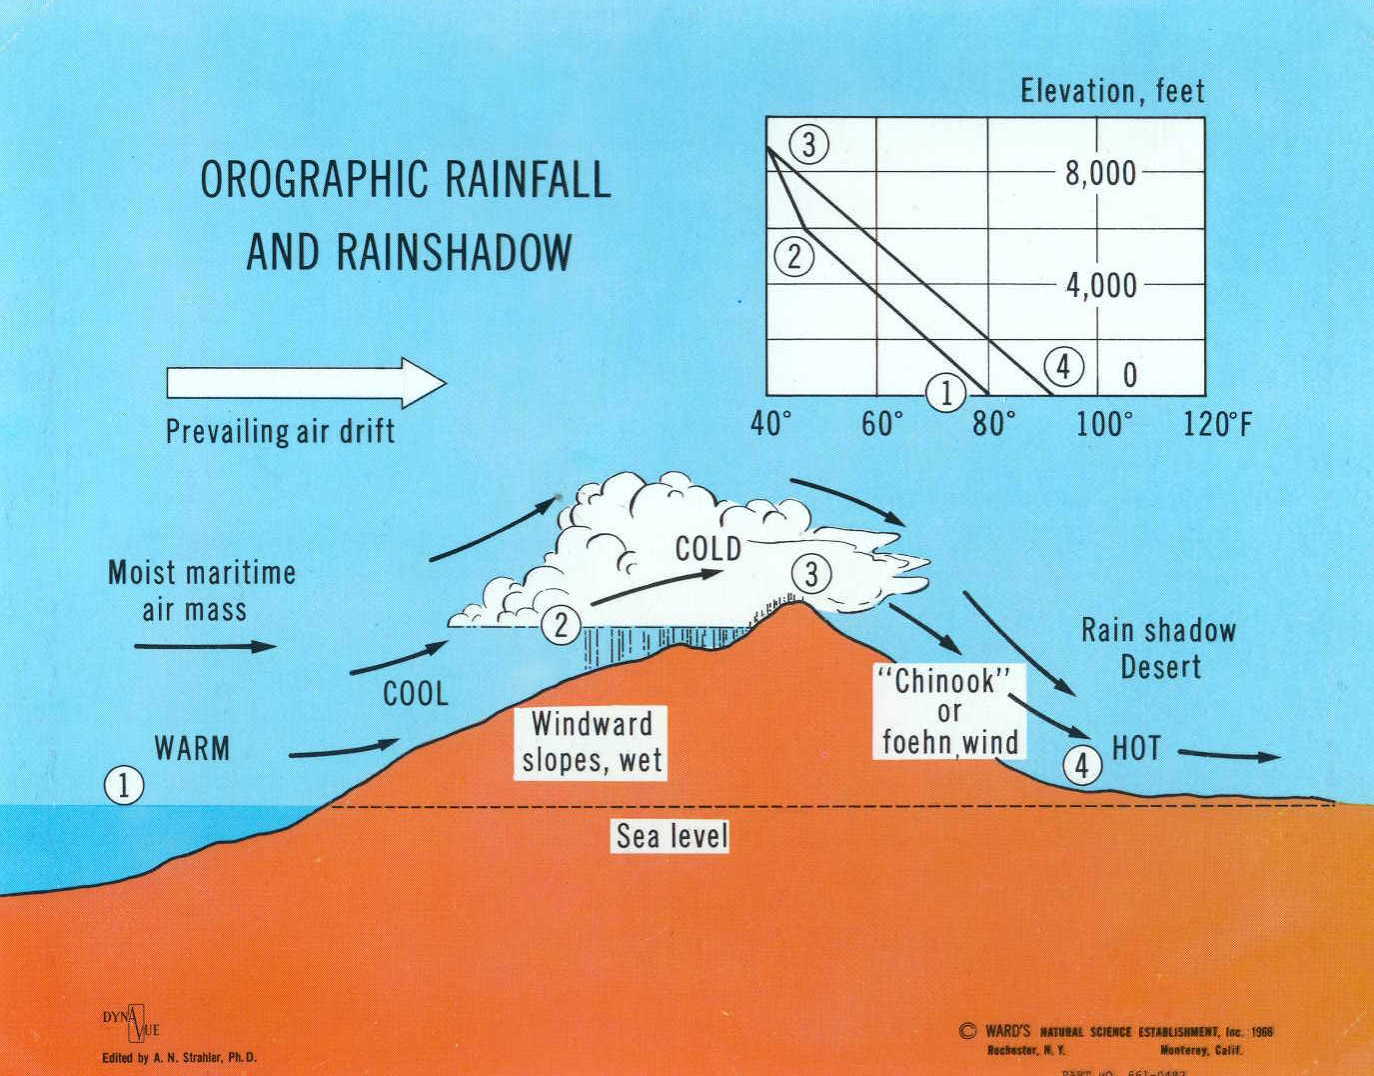
Orographic rainfall and rainshadow. |
|
|
 |
|
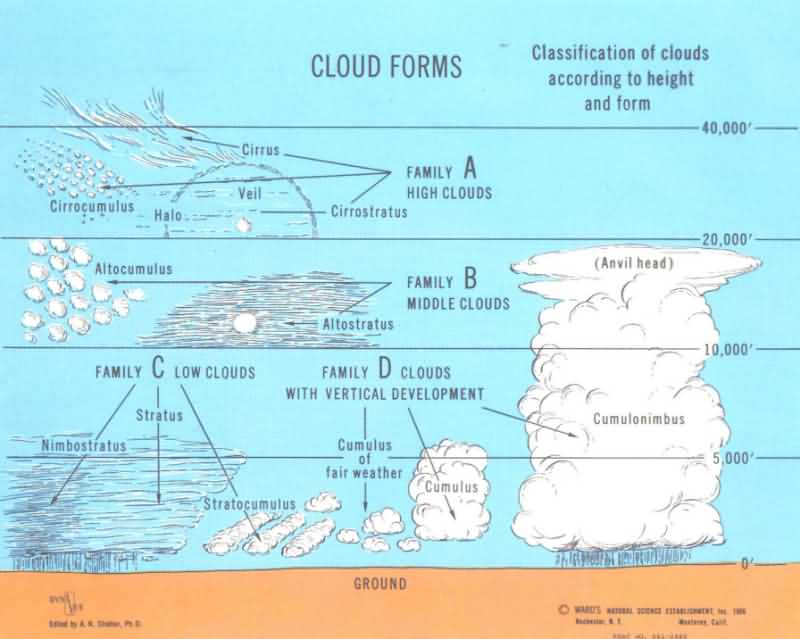
| Cloud forms. |
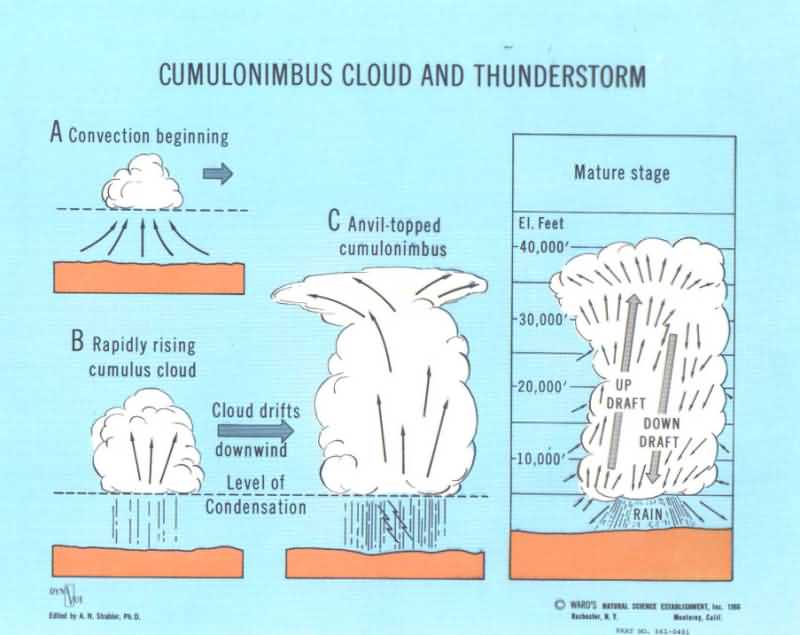
Cumulonimbus clouds and thunderstorms. |
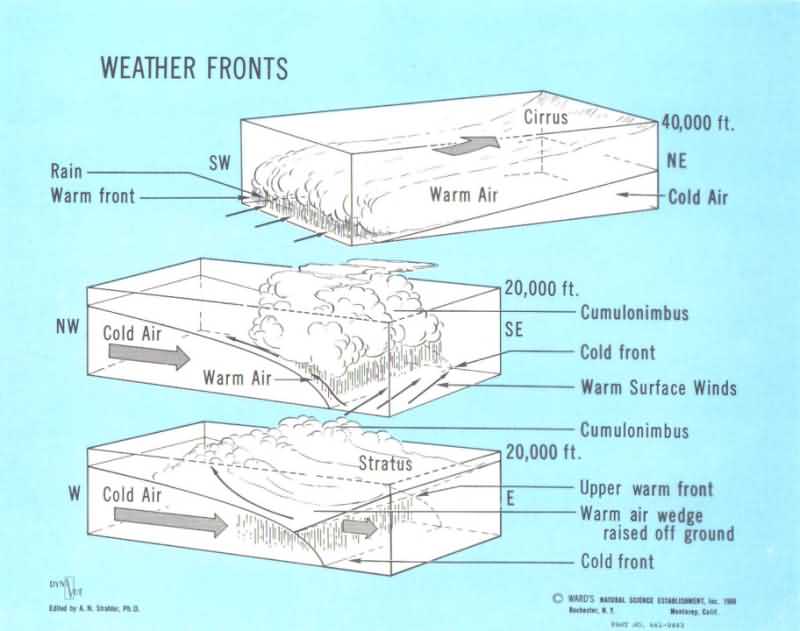
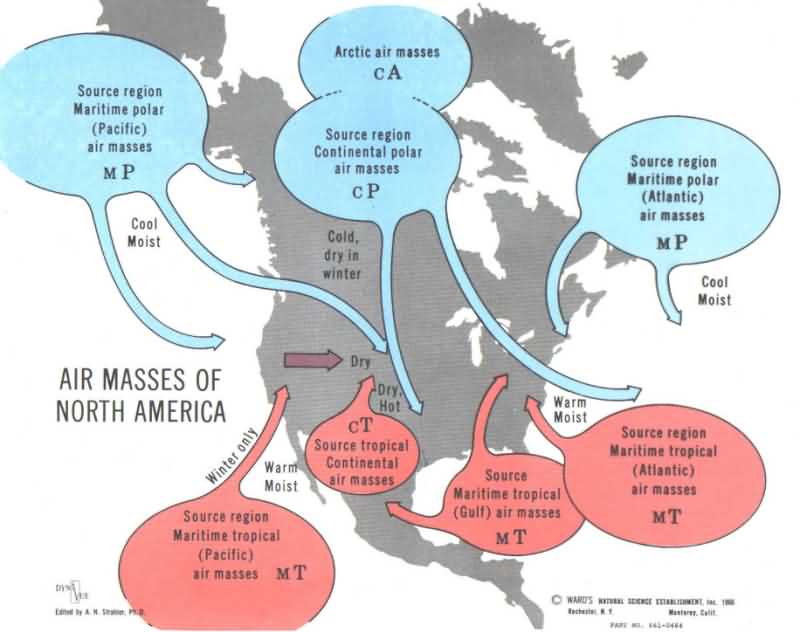
Air masses of North America. | Weather fronts. |
 |
|
 |
|
|
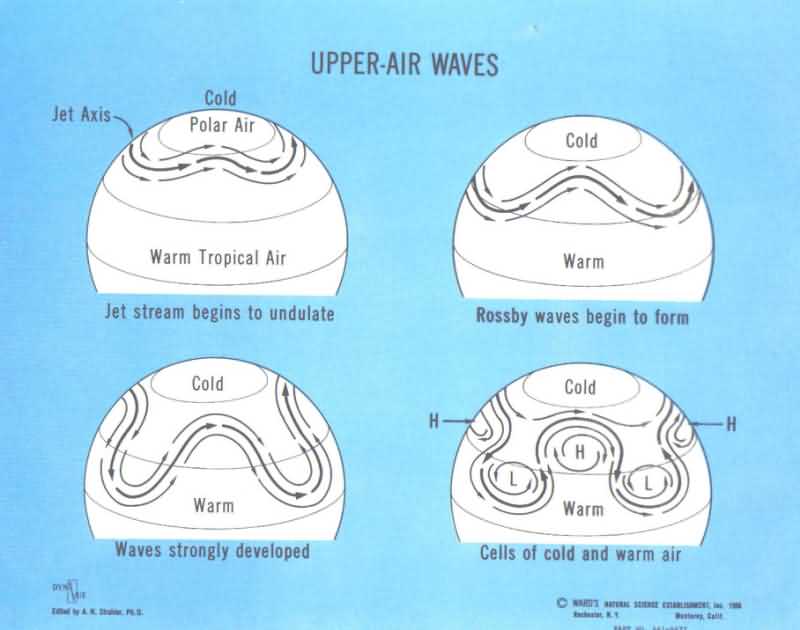
Upper-air waves.
|
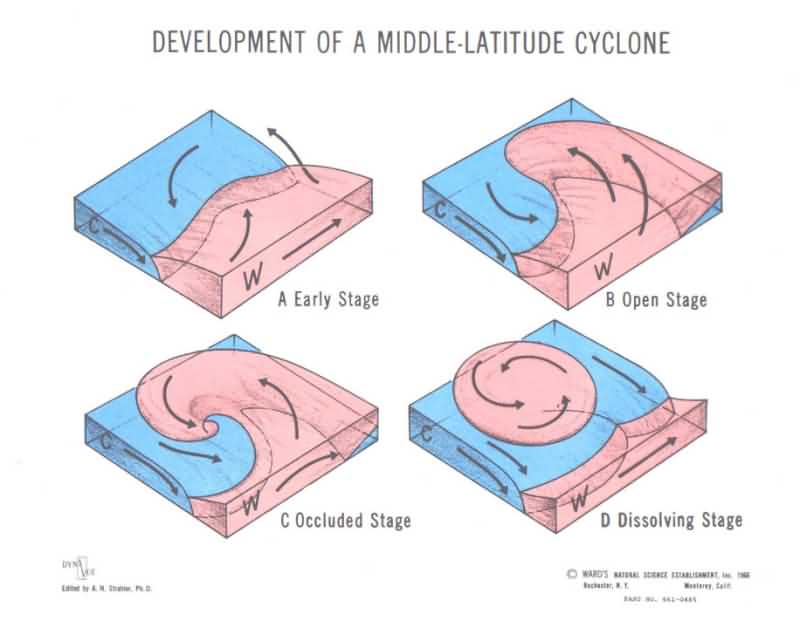
Development of a middle-latitude cyclone. |
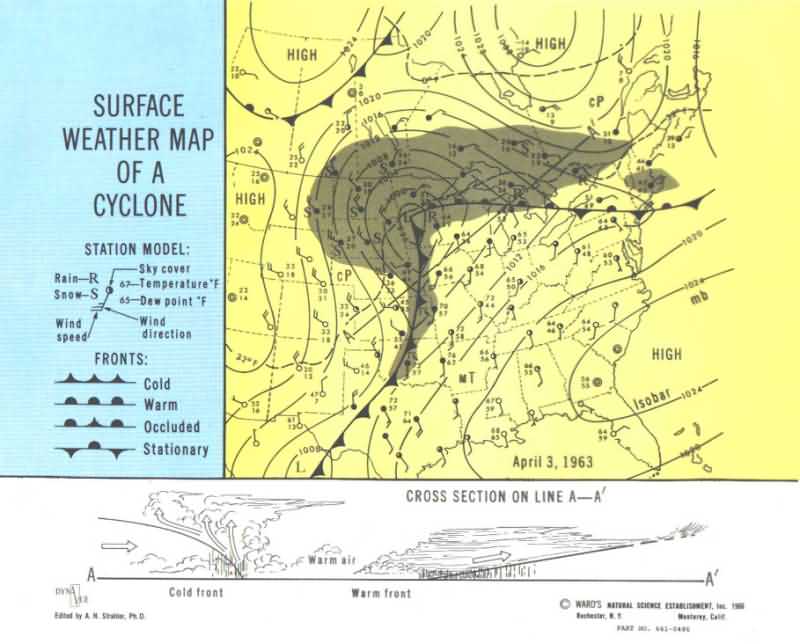
Surface weather of a cyclone. |
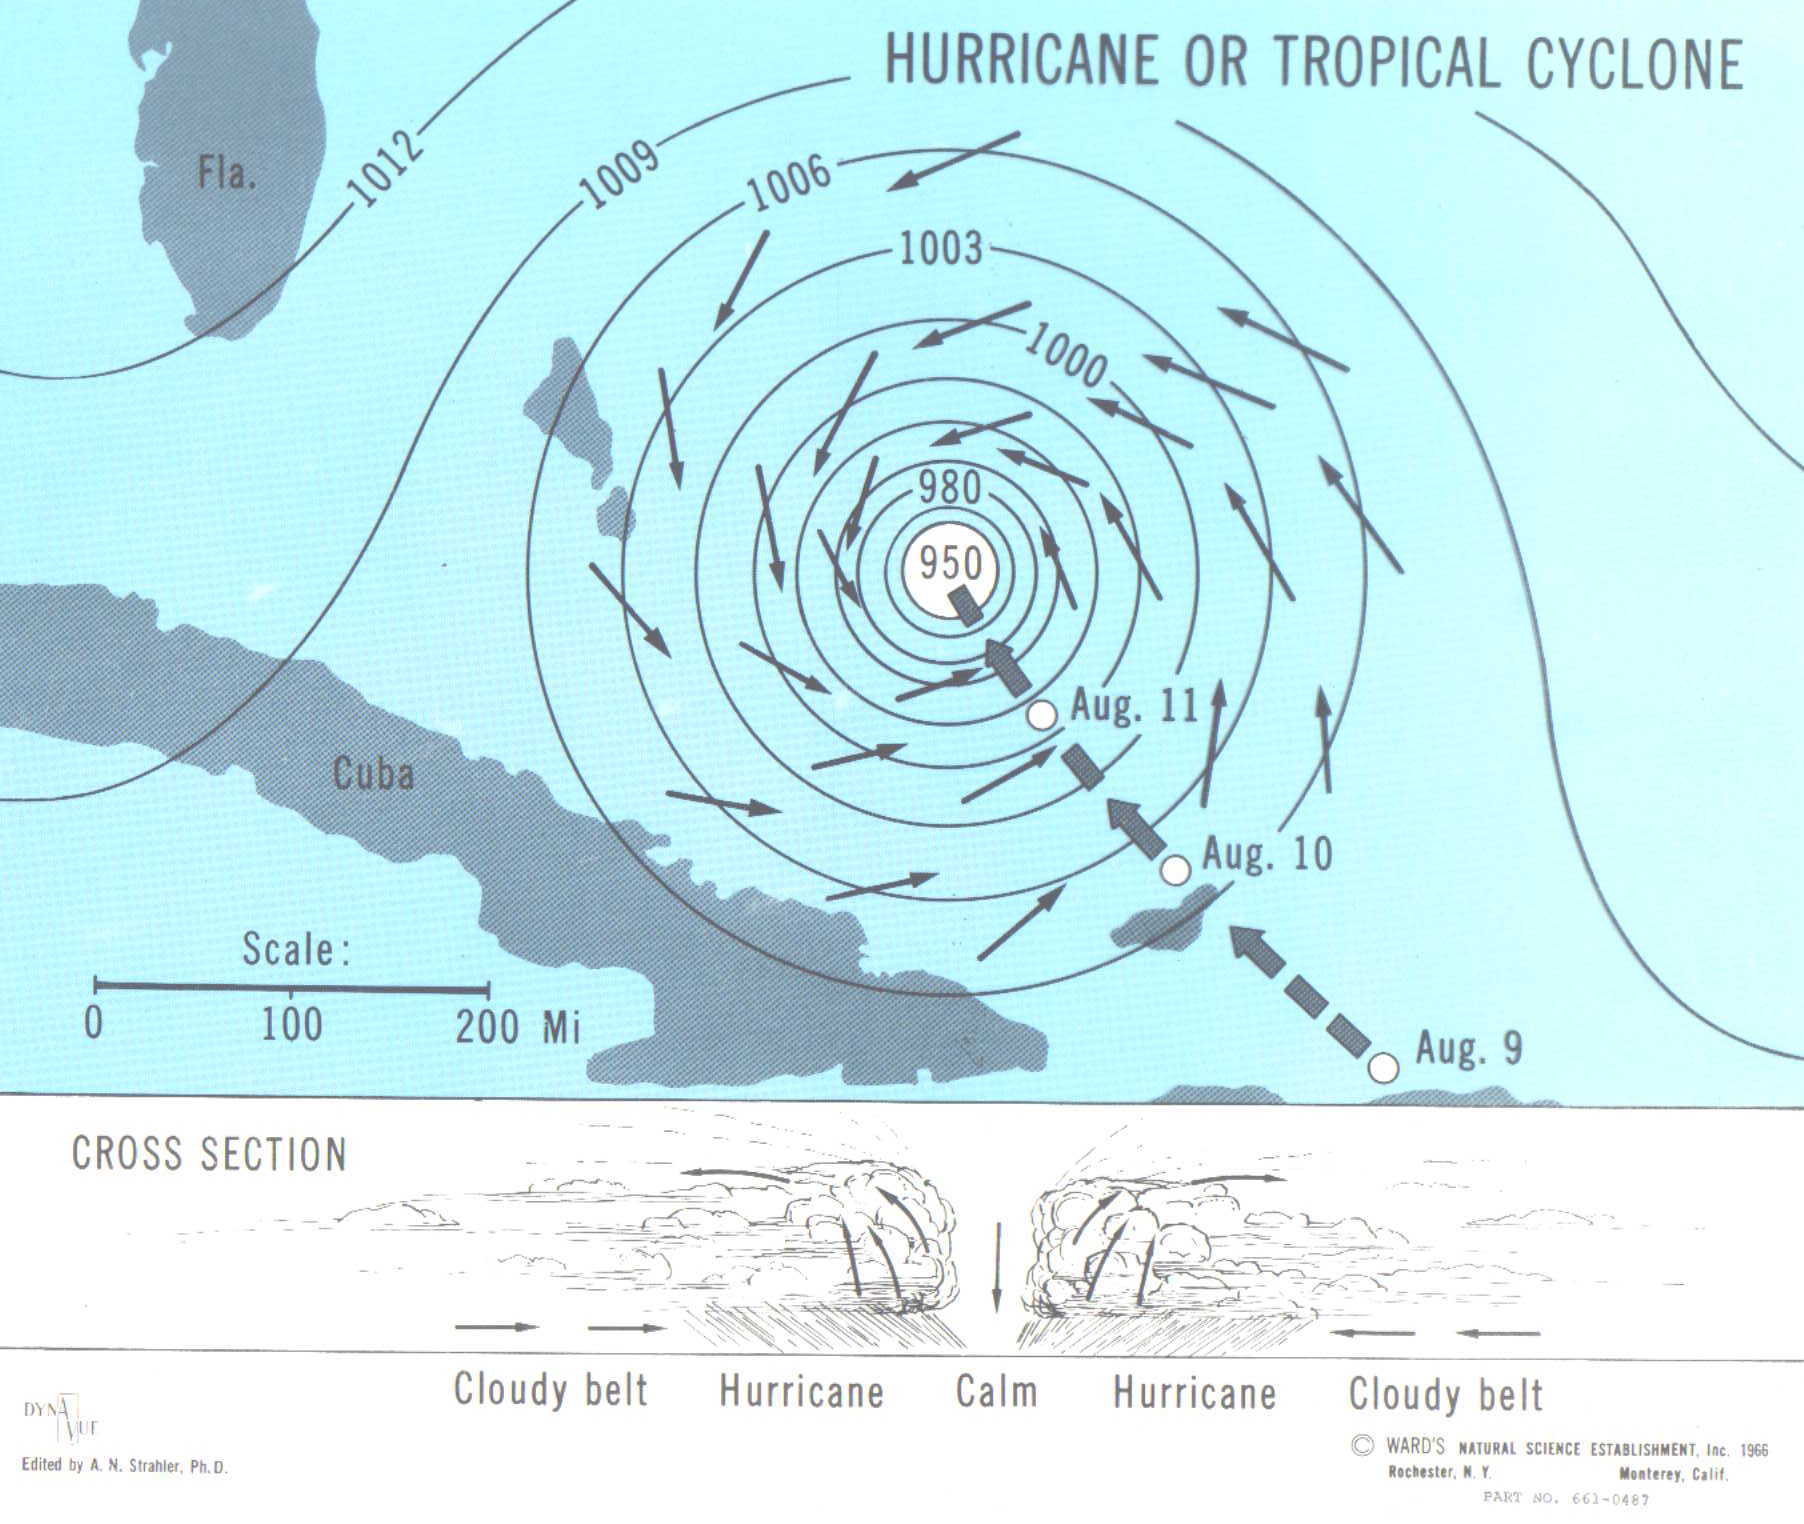
Hurricane or Tropical cyclone. |
| Marine sedimentation | |||
 |
 |
 |
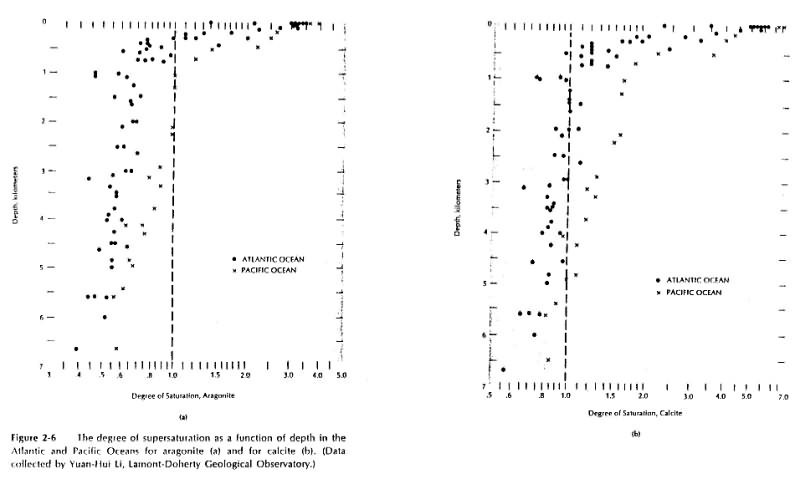 |
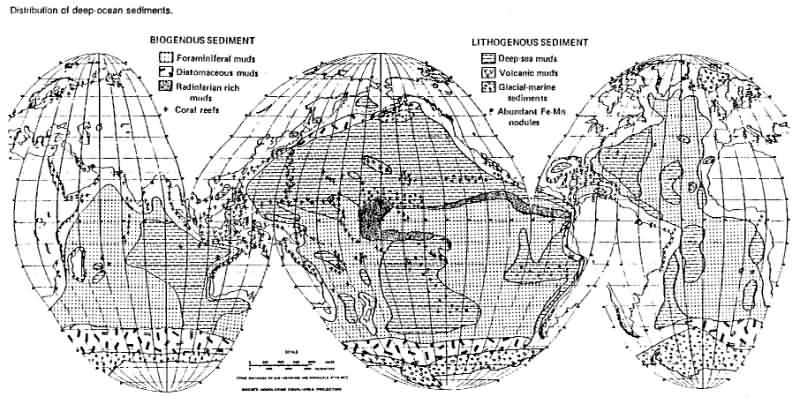
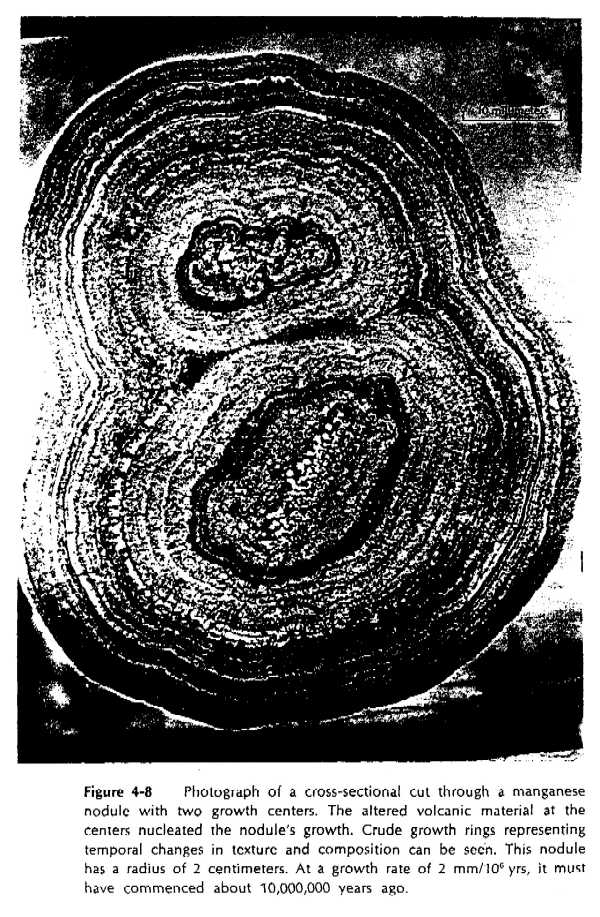
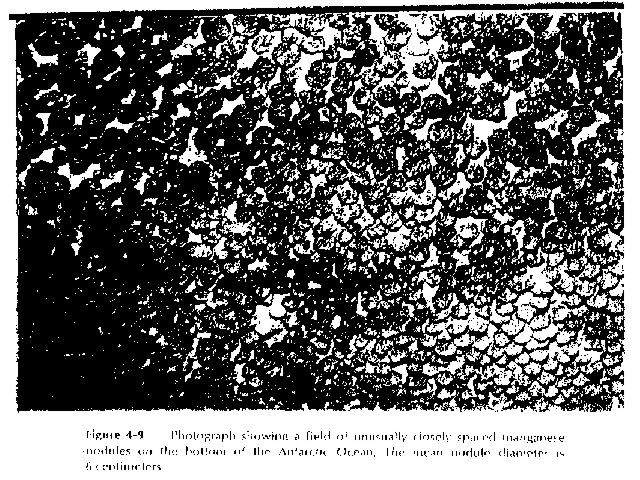
| Distribution of deep sea sediments. | Cross-section of a manganese nodule. Note concentric growth rings around two nucleation sites. | Manganese nodule field. The bulk of the nodules are at the surface. | Carbonate solubility in the oceans as a function of depth. |
 |
 |
||
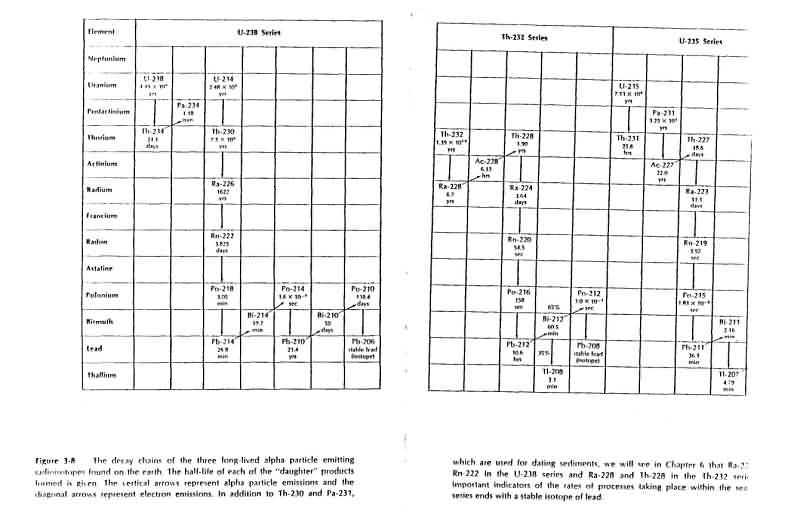
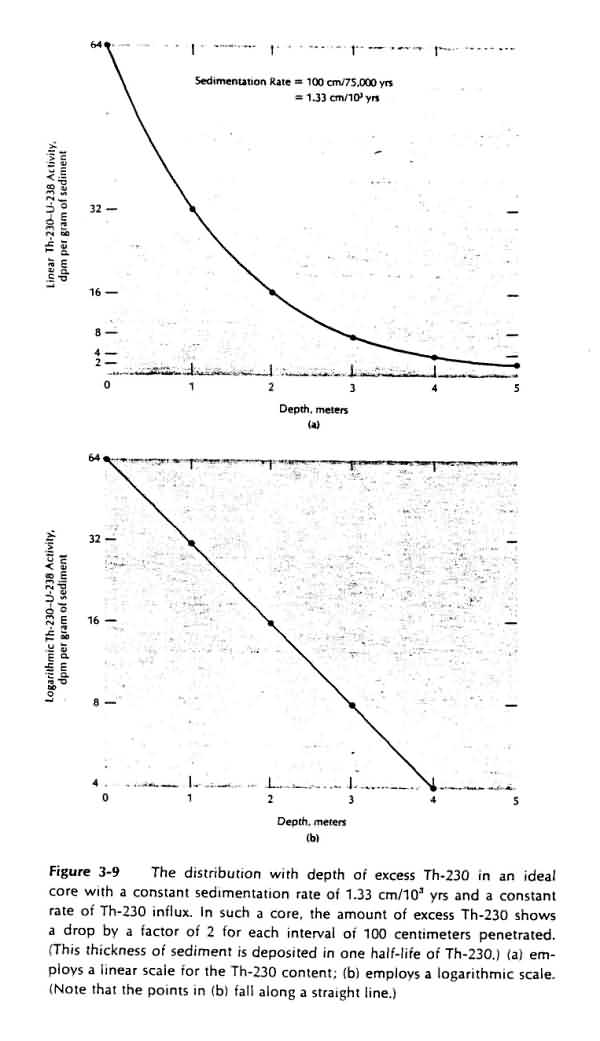
| Sea floor spreading and accumulation of various types of sediments. | U and Th decay chains. | Variations in radioactivity as a function of depth given a constant sedimentation rate. | |
| Physical processes in the ocean | |||
|
 |
 |
 |
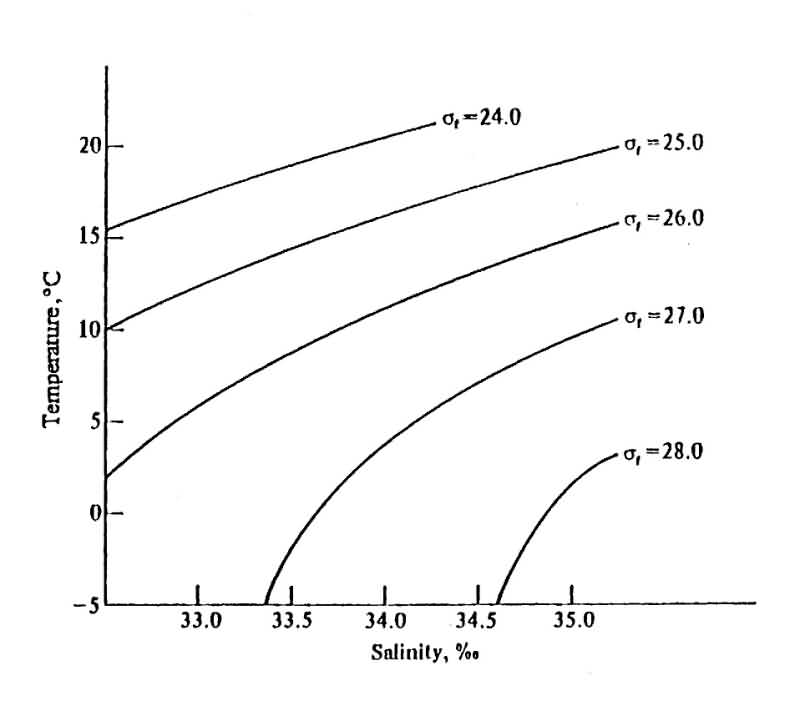
| Plot of sigma t surfaces on a salinity - temperature
diagram.
|
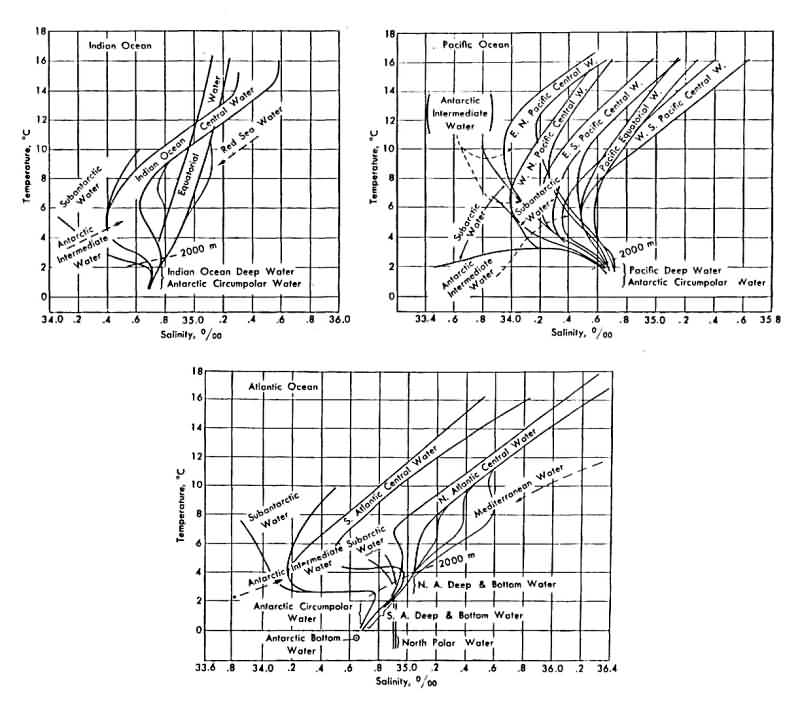
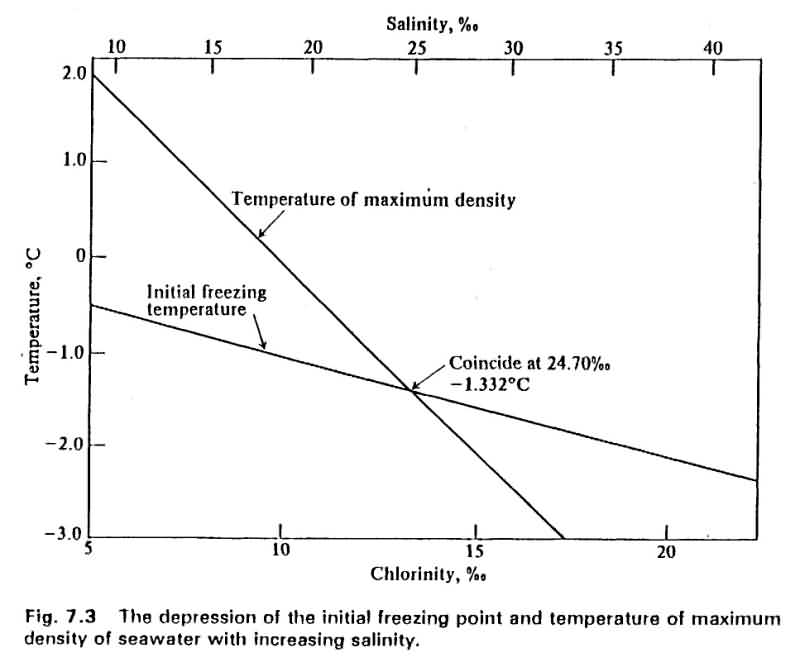
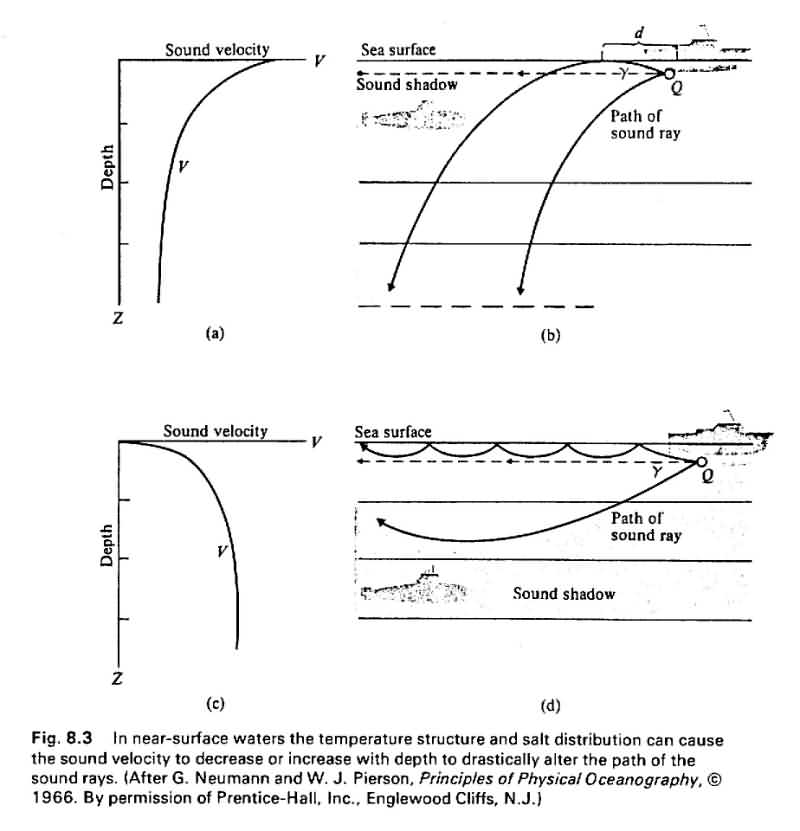
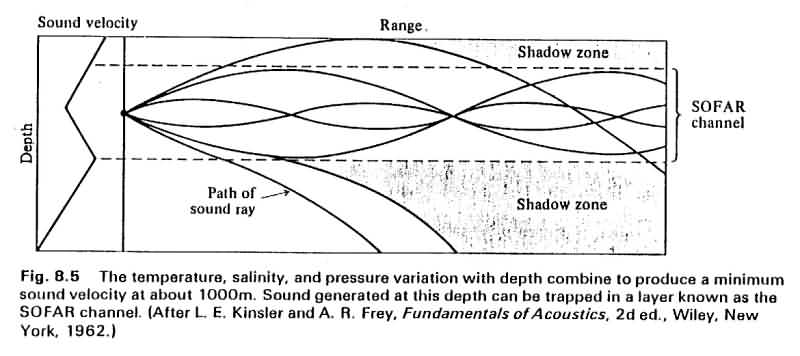
Temperature - salinity diagrams for the Indian, Pacific, and Atlantic oceans showing the various water masses. | Variations in temperatures of maximum density and freezing point as a function of chlorinity. | Variations in sound ray path as a function of vertical velocity changes 1. |
 |
 |
 |
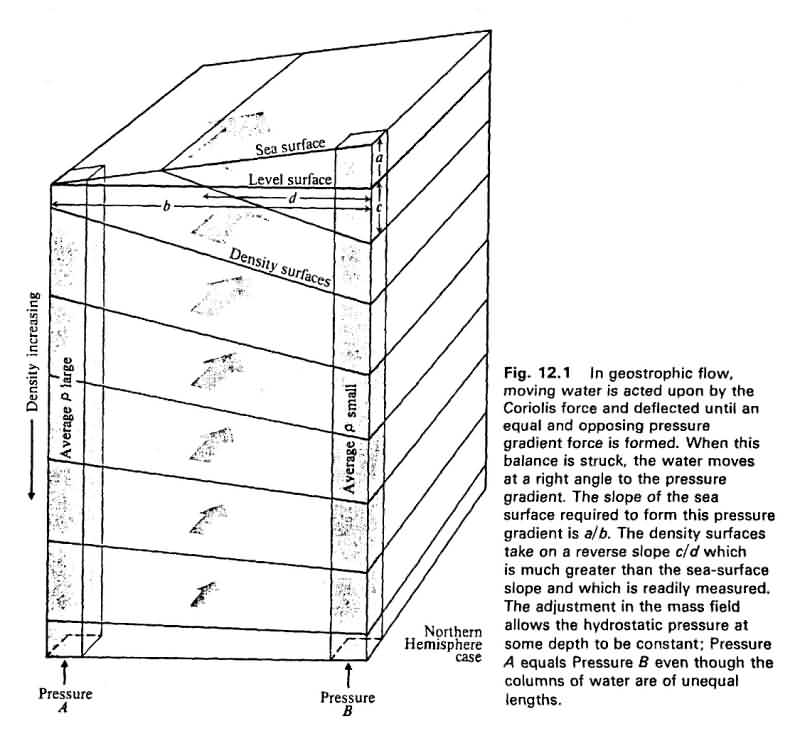 |
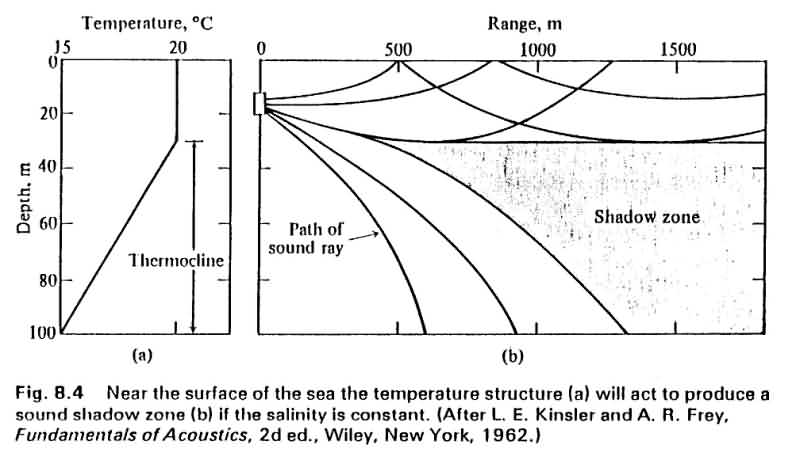
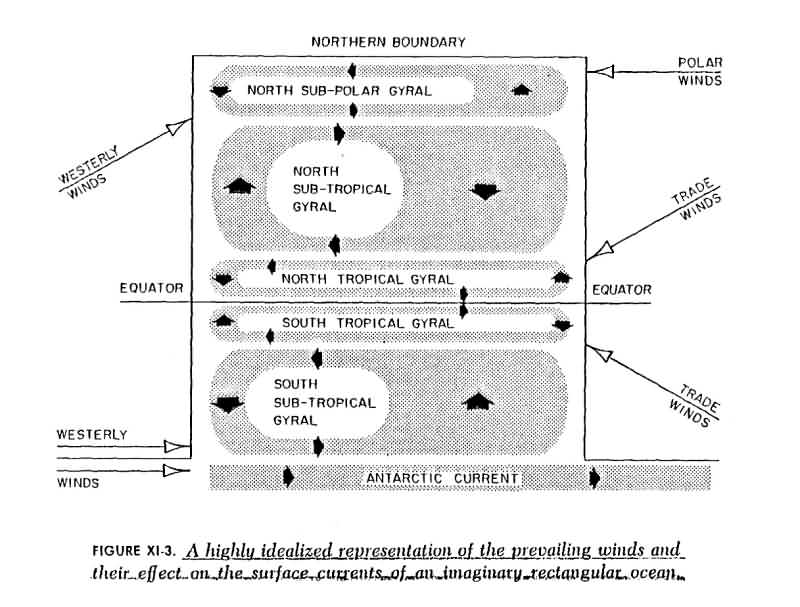
| Variations in sound ray path as a function of vertical velocity changes 2. | SOFAR channel. | Surface currents for an ideal Atlantic ocean. | Development of slope currents due to density differences. |
 |
 |
 |
|
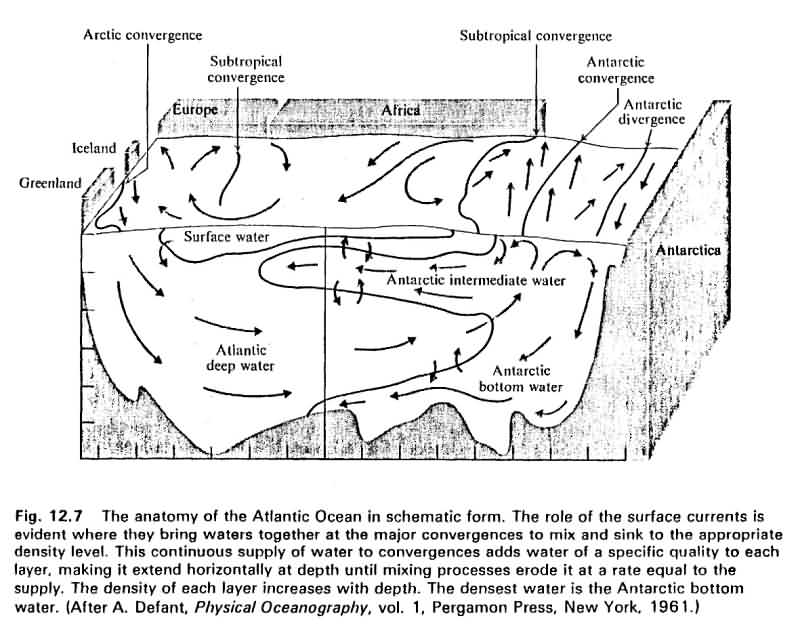
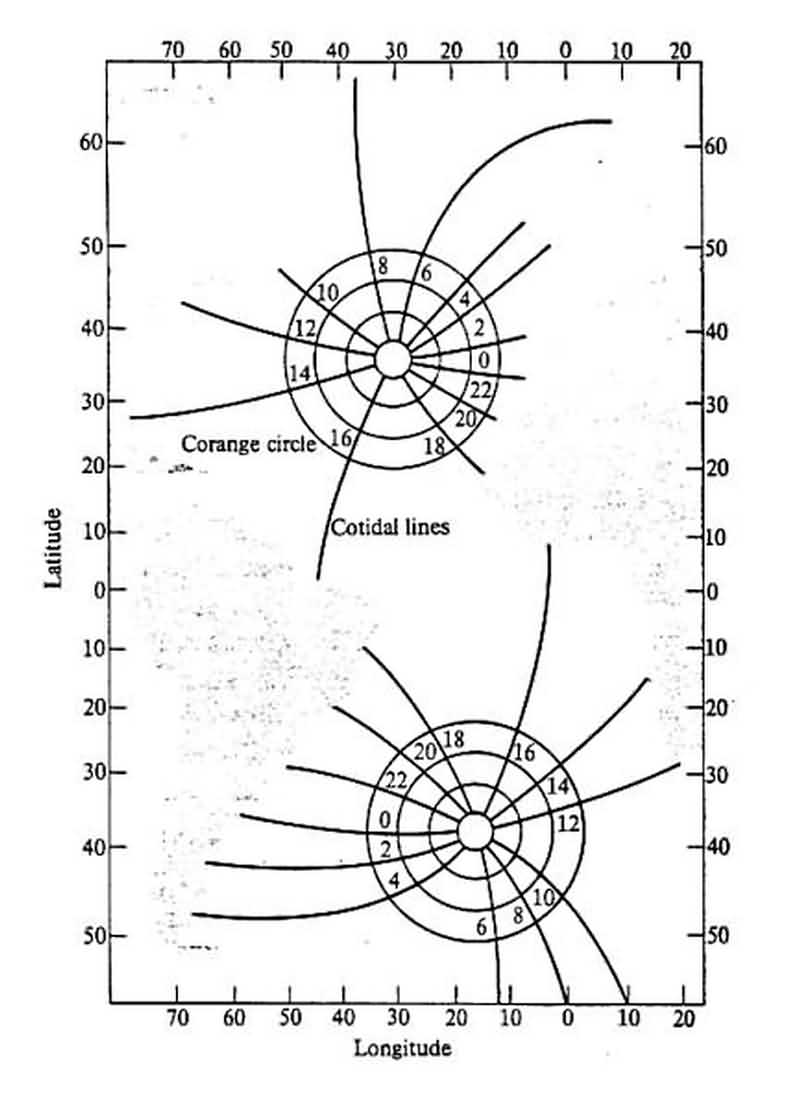
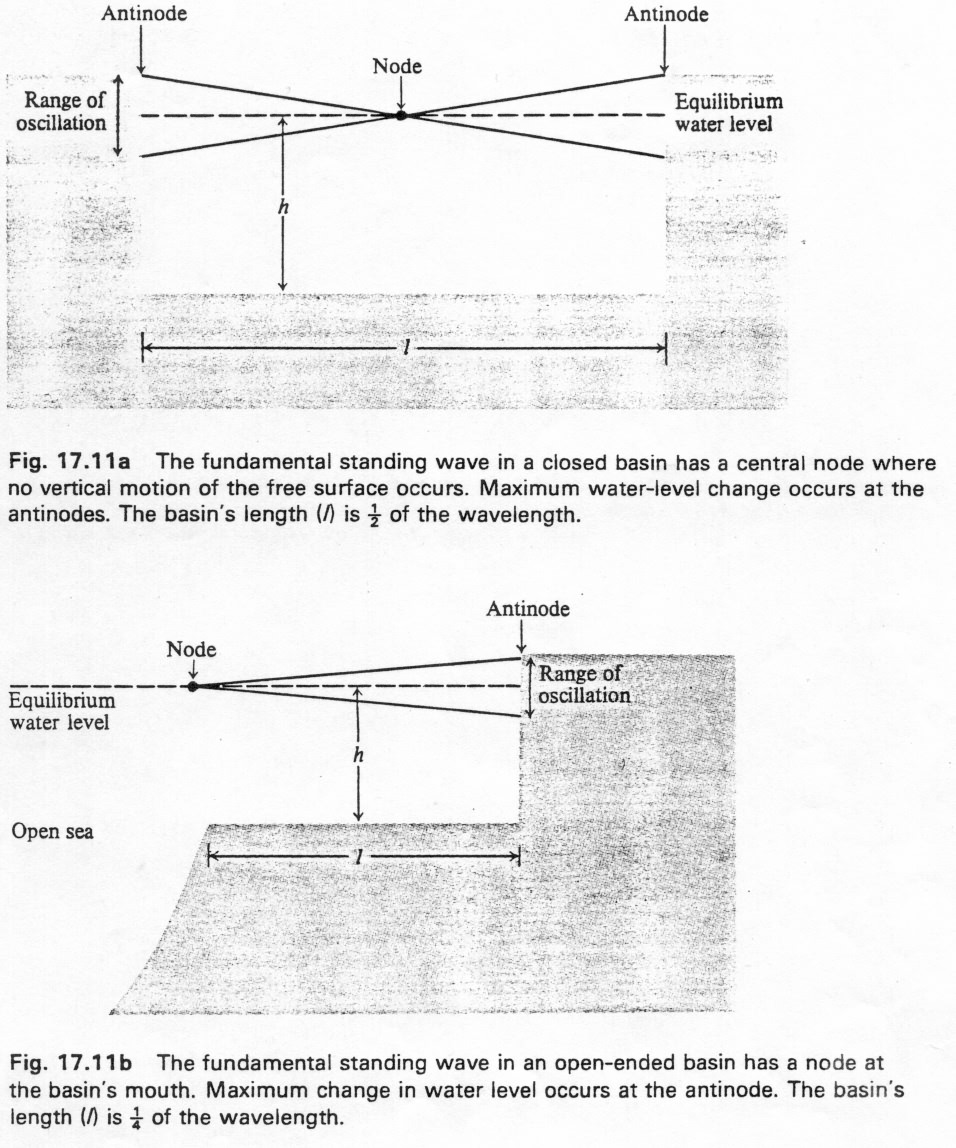
| Thermohaline circulation for the Atlantic ocean. | Rotary tides and cotidal lines. | Basins and resonance periods. | |