47.269 Research I: Basics
Between and Within Designs
Why think about it?
Okay, I have here some information about two groups, each of which has 10 participants.
|
Group A M = 40 |
Group B M = 50 |
Mean difference = 10 |
|
Group C M = 40 |
Group D M = 50 |
Mean difference = 10 |
![]() Which of these two is different from each other? A
and B? or C and D? Quickly thinking back to what you learned in week 4, you
tell me that you need more information to make that determination. Well, let’s
just look at all the data:
Which of these two is different from each other? A
and B? or C and D? Quickly thinking back to what you learned in week 4, you
tell me that you need more information to make that determination. Well, let’s
just look at all the data:
|
Group |
A |
B |
C |
D |
|
Raw Scores |
0 5 10 15 20 60 65 70 75 80 |
10 20 30 40 50 50 60 70 80 90 |
39.1 39.3 39.5 39.7 39.9 41.1 41.3 41.5 41.7 41.9 |
48 48.5 49 49.5 50 50 50.5 51 52 |
|
Mean |
40 |
50 |
40 |
50 |
|
SD |
32.49 |
25.82 |
0.35 |
1.29 |
So, now with this much information, which pair is different from each other: A compared with B or C compared with D?
Your intuition and good sense should tell you that there is so much overlap between the individual scores in A and B that an average difference of 10 doesn’t mean much.
On the other hand, the scores are so tightly clustered around the means for C and D that there is no overlap at all between the scores (the lowest D is higher than the highest C). So this same average difference (10) seems important here.
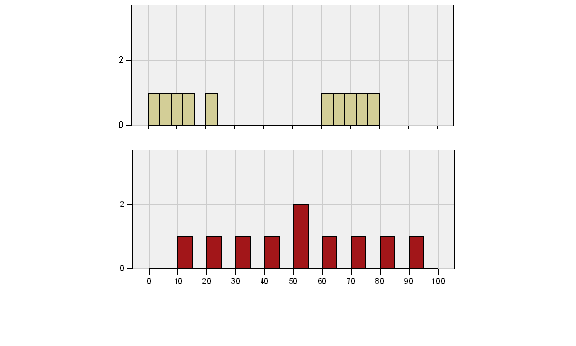
Let’s see what that looks like when we plot out the values for A and B, C and D.
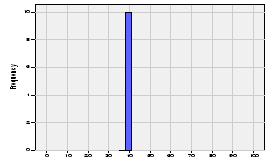
Group A
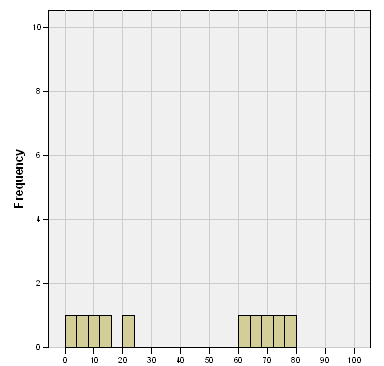
Group B
After looking at A & B, imagine the graphs were transparent and you could superimpose the graph of B upon A. How would the data line up? They would be overlapping each other, right? The maroon and the tan bars would look interspersed.
In contrast look at the following two groups.
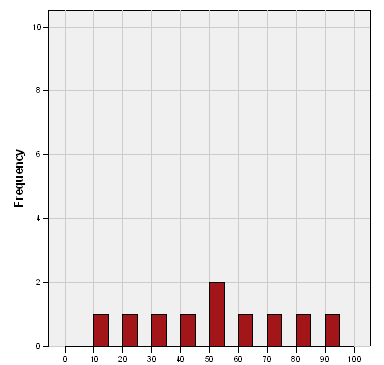
Group C
Group D
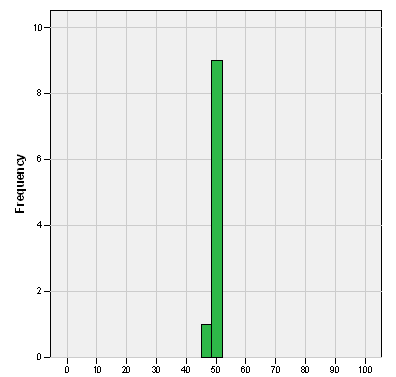
Okay, now that you have looked at C & D, imagine placing the graph for D right over the graph for C. What do you have? No overlap at all—the green and the blue are totally separated.

How can we quantify the differences that are clear to our eyes and our intuition?
We think of two groups of numbers as statistically different from each other when the difference between the groups can hold its own against the differences within the groups.
How do we assess differences within a group of scores—i.e., the variability of the data? We use the standard deviation. Check the SDs for these groups against their mean differences.
For A and B the SDs are about 32 and 26 (average them together for 29). How does that compare to the differences between the groups?
Diff between AB / diff within AB = 10/29 or about 1/3 or 0.33
Compare C and D in the same fashion. The SDs pf .35 and 1.29 average to about .82. How does that hold up to the difference between?
Diff between CD / diff within CD = 10/.82 or about 12/1 or 12
So, because the difference between the groups outweighs the differences among the members within the group for C v. D by a factor of 12, but only by a factor less than 1 for A v. B, we are more confident that the numbers in describing C as different than D.
In research, if we considered these groups of 10 as samples of populations, then we would be confident in concluding that C and D were not drawn from the same population, but from different ones. We would reject the notion that they are the same.
We could not, however, reject the idea that the samples for A and B represent separate and distinct populations. They appear to be drawn from the same one with their similar distributions.
If this were a research study then and we applied the appropriate statistical analyses to these groups of 10 to compare A with B and C with D, we would reject the null hypothesis for C v. D, but fail to reject the null hypothesis for A v. B.
(Pssssst: Null hypothesis is the one that says no difference. Only for C v. D can we reject the hypothesis that they are not different.)
Got it?
 Good!
Good!
In fact, all comparative statistics boil down to one conceptual formula:
Test statistic = (difference between/difference within) * size of study
You will come back to this a bit later in this course and much, much more in Research II. For now, it is the concept that is critical.
Thinking about variability within the groups is a major factor in deciding whether to use a within or between research design.
Now, on to design…