47-512  Applied Research Methods

Spring 2003

Exam I:  A lesson in descriptive statistics and distributions
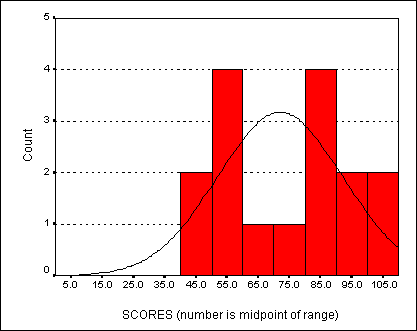
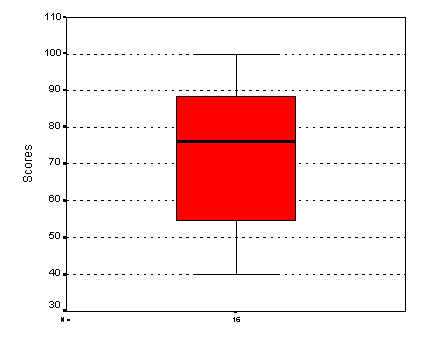
 

Text Box: Here are the raw scores and the Z-scores for the first exam.  

Recall that a Z-score tells you how many standard deviations away from the mean the score is.  Negative numbers are below the mean, positive are above. 

The Z-scores (also called standard scores) are based on Mean(SD) = 71.9(20.1).  If one of these scores were to change, the mean, SD, and the z-scores would all change too.


Score

Z-score

40

-1.59

42

-1.49

50

-1.09

54

-.89

55

-.84

57

-.74

67

-.25

72

.00

80

.40

81

.45

85

.65

87

.75

90

.90

91

.95

100

1.40

100

1.40


Text Box: Histogram of the test scores.

A normal curve with mean= 71.9 and a SD= 20.1 is super-imposed on the distribution.  You can see the distribution of our test grades is not especially normal; rather it is bimodal.


Text Box: Boxplot for the test scores.  

Go back to the ranked raw data. Find the “cut points” that divide the scores into 4 even groups (midpoint of intervals when N is even). Compare to %iles here.


Next time:  Skewed to the left with ceiling effect!