 The Blue Marble
Principles of
Earth & Environmental Systems I
ENVI.2010
|
|
Principles of
Earth & Environmental Systems I |
| Course Home | Syllabus | Schedule | Supplemental Materials | Links |
| PDFs of Lecture PowerPoints | |||
| The Earth System | |||
| Plate Tectonics | |||
| Earth Resources | |||
| Energy Resources | |||
| Supplemental Graphics | |||
| Origin of the stars and the solar system | |||
 |

|
 |

|
| Hertzsprung-Russell (H-R) diagram showing spectral classes and luminosity of stars and types of stars. | Stellar evolution as shown on an H-R diagram. | Abundances of the chemical elements in the solar system. | Chart of the nuclides showing all naturally occurring and long-lived radionuclides. |
 |

|
 |

|
| Nucleosynthesis in red giants. | Variations in density of planets with mean distance from the sun. | Classification and abundance of meteorites. | Chemical compositions of meteorites. |
 |

|
||
| Radiometric ages for meteorites. | Sequence of condensation of minerals from the solar nebula. | ||
| Origin of the planetary atmospheres | |||
 |
 |
 |
 |
| Maxwell distribution of velocities among atoms of three gases at 1000K. | Carbon, hydrogen, and nitrogen for Venus, Earth, and Mars. | State of water for Venus, Earth, and Mars. | Cooling rates for the terrestrial planets and the moon. |
| Plate tectonics | |||
 |
 |
 |
 |
| The hypsographic curve. | Cross section of the Earth's crust. | Glomar Challenger and deep sea drilling. | History of plate tectonics. |
 |
 |
 |
 |
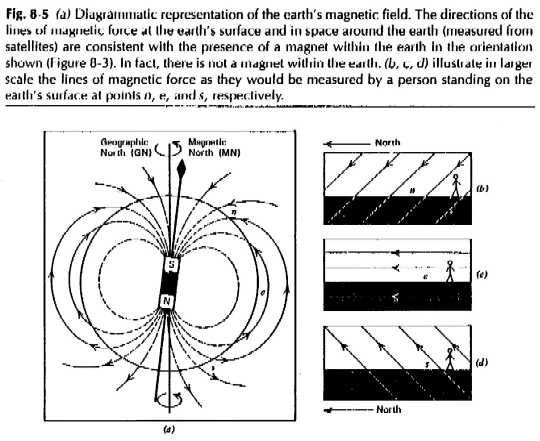
| Diagrammatic representation of the earth's magnetic field. | Relationship between the earth's magnetic field and geographic and magnetic latitude. | Polar wandering curves for North America and Eurasia. | Polarity reversals as evidenced in a seafloor sediment core. |
 |
 |
 |
 |
| Changes in intensity of the magnetic field during a 40,000 year period. | The polarity reversal time scale for the last 4+ million years. | Relationship between magnetic anomalies and seafloor spreading. | Seafloor spreading rates for various oceans. |
 |
 |
 |
 |
| Relationship between magnetic and sediment ages for the seafloor and distance from a ridge crest. | Distribution of earthquake epicenters. | Relationships between earthquake epicenters, foci, and island arcs. | Distribution of lithosphere plates and plate boundaries. |
 |
 |
 |
 |
| Ocean ridges and transform faults. | Cross-section through the outer layers of the earth. | Continental drift - 180 million years ago to present. | Continental drift - 510 million years ago to 225 million years ago. |
| Surface and groundwater | |||
 |
|||
| Schematic representation of the hydrologic cycle. Numbers in parentheses are the volume of water (106 km3) in each reservoir. Fluxes are given in 106 km3 y-1. From Berner and Berner (1996). | |||
| Pollution and Public Policy | |||
 |
 |
 |
 |
| Principal health and productivity consequences of environmental mismanagement. | Environmental indicators and per capita income. | The policy life cycle. | Environmental problems and the policy life cycle. |
 |
 |
||
| Totally yearly costs of pollution control in the U.S. | Environmental policies related to costs and benefits. | Cost-benefit ratio for reducing pollution. | Cost-effectiveness evaluation over time. |
 |
 |
 |
 |
| Benefits that may be gained by reduction and prevention of pollution. | Some environmental hazards ranked according to risk. | Risks to ecology and human welfare, as developed by the EPA's Science Advisory Board. | Public concerns vs. the EPA's top 11 risks |